Average engagement time per session is the time visitors had your site open in the foreground, divided by the number of sessions. Engaged sessions are the sessions that ran longer than ten seconds, fired a key event, or produced at least two page views — one of the three is enough. Both numbers sit in GA4 under Reports → Engagement; average engagement time per session also appears in the Traffic acquisition and Landing page reports. A "time on page" metric like the one in Universal Analytics no longer exists in GA4.
Anyone moving from the old version of Google Analytics to GA4 goes looking for average session duration first and cannot find it. It is not a bug and not a hidden menu. The metric no longer exists in its old form, and the reason for that is better than the annoyance it causes. What it does have is a successor under a different name, a namesake that is not the same thing, and a calculation worth understanding before you read either number.
Why average session duration disappeared
The old duration was an estimate with a built-in hole. Analytics could only measure the time between two page views. The last page of a session had no second timestamp, so it counted as zero seconds. Someone who opened a page, read for four minutes and then left recorded a session of zero seconds. For pages people read to the end and then leave, average duration was therefore systematically too low, often by more than half.
GA4 measures something else: the time the tab was actually in the foreground. If your article sits in a background tab, the clock stops. That is more honest, and it makes the old and new numbers incomparable. A drop in duration after the switch is almost always a measurement effect, not a change in behavior.
What engagement time measures
GA4 counts foreground time. The browser reports how long a page was visible and focused, and sends that along with the events it collects. Minimize the window, switch to another tab, put the phone in your pocket, and the clock stops until you come back.
How engagement_time_msec is calculated
GA4 does not send a running clock. It sends slices. Every event the tag fires carries a parameter called engagement_time_msec — in the network request it is shortened to _et — holding the milliseconds that accumulated since the previous event on that page. The counter only runs while the document is visible and the window has focus; the browser's visibility state decides, not a timer.
Because a page can sit there for minutes without firing anything, GA4 flushes the remainder with a user_engagement event when the page moves into the background, loses focus, or is closed. That is the piece the old metric never had: the last slice of the last page still gets sent.
The reports then add these slices together. Summed per session and divided by sessions, they give average engagement time per session; summed per person and divided by active users, average engagement time per active user. Two things follow. A visit with a single page view still produces a real number, because the flush event delivers one. And when the flush never happens — a crashed tab, a browser that kills the process — that final slice is simply lost, which is the one direction in which GA4 still undercounts.
In numbers: a visitor opens an article, and the page_view event fires with no engagement time attached yet. Twelve seconds in they scroll, and the scroll event carries engagement_time_msec=12000. After another 48 seconds of reading they switch tabs, and the flush sends user_engagement with 48000. The page has now earned 60 seconds of engagement time — and no single event ever carried that total.
Watching engagement_time_msec live
The parameter is easy to see for yourself, and watching it once makes the whole model stick:
- Open your own site in a fresh tab, then the browser's developer tools with F12, switch to the Network tab and type
collectinto its filter field. - Scroll, click, switch to another tab and come back. Every request to
/g/collectis one batch of events; select one and look for_etin the payload. - Note what it does: absent on the very first request, present afterwards, and never a running total — always just the milliseconds since the previous event.
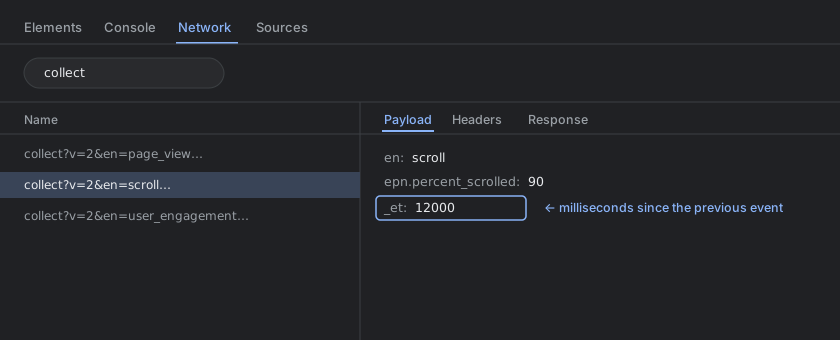 The payload of a single scroll event: _et holds the twelve seconds that passed since the previous event — a slice, never a running total.
Out of that one raw number GA4 builds two averages that look alike and are not.
Average engagement time per session
Total engagement time divided by the number of sessions. You find it wherever GA4 counts sessions: the Engagement overview, "Traffic acquisition", the "Landing page" report.
One detail explains most of the disappointment with this number: it divides by all sessions, including the ones that ended after two seconds with nothing measured. A page with a solid readership and a lot of accidental traffic will show a low average without a single reader having done anything wrong. Which is why the value is worth little on its own and a lot next to the engagement rate: a low average with a high engagement rate means short visits, a low average with a low engagement rate means the wrong visitors.
Average engagement time per active user
The same total, divided by active users instead. It is the column in "Pages and screens", and on some scorecards GA4 shortens it to plain "average engagement time" — the same words the per-session metric uses in other reports, which is where most of the confusion between the two starts.
Someone who visits three times in a week counts as one active user and as three sessions. The per-user value is therefore the larger of the two, regularly by a factor of two. Which one you want depends on the question. Per session answers "how much attention does one visit get". Per active user answers "how much attention does one person give this site over the period".
Engaged sessions: what actually counts as one
A session counts as engaged in GA4 as soon as one of three conditions is met:
- it lasts longer than ten seconds in the foreground,
- it includes at least one key event (what used to be called a conversion),
- it produces two or more page or screen views.
One condition is enough — they are not cumulative. A visitor who lands on a page, spends four seconds, clicks through to a second page and leaves has an engaged session by way of condition three, no matter how brief it was.
Engagement rate and engaged sessions per active user
Two metrics are derived from engaged sessions. Engagement rate is engaged sessions divided by all sessions. Engaged sessions per active user tells you how many worthwhile visits one person contributed. And bounce rate in GA4 is nothing but the counter-value: 100 percent minus the engagement rate, which is why it needed a separate explanation. Condition two is the only one you control directly, and it never fires while no key event is marked — which makes it a conversion tracking job before it is a reporting one. Why the conversion column in those same reports can stay empty is in GA4 conversion not showing.
Raising the ten-second threshold
The ten seconds are not carved in stone. Under Admin → Data collection and modification → Data streams → your web stream → Configure tag settings → Show more → Adjust session timeout you can raise the engaged-session timer as far as 60 seconds. That is worth doing for sites where ten seconds is nobody's idea of interest — a long-form blog, say. Be aware that the change applies going forward only; historical data keeps the old threshold, which puts a step in your chart on the day you switch.
A worked example: four sessions, every metric
The definitions are easier to hold on to with numbers attached. Say one afternoon brings your site three people and four sessions:
| Session | Visitor | Foreground time | Page views | Key event |
|---|---|---|---|---|
| 1 | Anna | 40 seconds | 3 | — |
| 2 | Anna | 20 seconds | 1 | — |
| 3 | Ben | 90 seconds | 2 | form submit |
| 4 | Carla | 4 seconds | 1 | — |
Total engagement time is 154 seconds, and from that one column GA4 derives every metric this article has covered:
- Average engagement time per session: 154 seconds over four sessions, roughly 39 seconds.
- Average engagement time per active user: the same 154 seconds over three people, roughly 51 seconds — a third larger, only because Anna came twice.
- Engaged sessions: three. Sessions 1 to 3 pass the ten-second mark, and session 3 would qualify twice over with its two page views and the key event. Carla's four seconds with a single page view and no key event fail all three conditions.
- Engagement rate: three engaged sessions out of four sessions, 75 percent. Bounce rate is the remainder, 25 percent.
- Engaged sessions per active user: three engaged sessions across three people, 1.0.
Carla's session shows the mechanism from above in miniature: her four seconds count into the totals and pull the per-session average down, yet her session never becomes an engaged one. More accidental traffic moves both numbers the same way — the average falls and the bounce rate climbs, without a single reader behaving differently.
GA4 session duration: the metric that is still there
"Average session duration" was not deleted, it was demoted. It appears in no standard report, but you can add it in an exploration or in a customized report, and Google defines it plainly as the average duration of users' sessions. A session's duration is the span from its first event to its last — wall-clock time, background tabs included.
That puts it between the two other numbers. Unlike the old Universal Analytics metric it no longer collapses the last page to zero, because session_start at one end and the flush event at the other give it two honest timestamps. Unlike engagement time it does not care whether anyone was looking. Use session duration for "how long was this visit alive", engagement time for "how long did somebody actually look at it". Where the two drift far apart on a page, you have found the tabs people park and come back to.
Step by step: finding average session duration
Since no standard report carries it, you fetch it yourself once:
- Open Explore in the left navigation and start a blank exploration.
- Under Variables, click the plus next to Metrics, search the list for "Average session duration" and import it.
- Drag the metric into Values and a dimension into Rows — "Session source / medium" is the usual start, "Landing page + query string" when you want it per page.
- If it should live in a table permanently, the same metric can go into a standard report via Admin → Report display → Customize reports.
What comes out is wall-clock time. Do not expect it to match average engagement time per session: it is almost always higher, and that is not a contradiction but the difference between "open" and "looked at".
The 30-minute timeout behind every session
A session in GA4 ends after 30 minutes without an event. That is the default, and it is why no session duration ever covers a whole afternoon in one go: come back after a 31-minute break and you start a second session, and both go into the average separately. Under Admin → Data collection and modification → Data streams → your web stream → Configure tag settings → Show more → Adjust session timeout the window can be set anywhere between five minutes and seven hours 55 minutes — the same panel that holds the ten-second timer for engaged sessions.
Engagement time does not care where that boundary falls; it counts foreground time either way. Everything with "per session" in its name does move with it: a shorter timeout produces more and shorter sessions, a longer one fewer and longer ones. And as with the ten-second threshold, the change only applies going forward.
Engagement time vs. time on page
The comparison people usually want is against "time on page" — the Universal Analytics metric, and the label a lot of other tools and CMS statistics still use. The two answer different questions, and the differences are systematic rather than random:
| Engagement time (GA4) | Time on page (Universal Analytics) | |
|---|---|---|
| What the clock measures | Foreground time: tab visible and in focus | The gap between two page-view timestamps |
| Background tab | Clock stops | Keeps running |
| Last page of a visit | Counted, flushed by user_engagement | Zero seconds |
| Single-page visits | Measured normally | Not measurable at all |
| Blind spot | The final slice, if the tab dies before it is sent | Every exit page, by design |
| Where you read it | Engagement reports, per session and per active user | Retired with Universal Analytics |
Practically: if you are holding GA4 next to a heatmap tool or a plugin that still reports time on page, expect GA4 to show the lower number on pages people keep open in a tab, and the higher one on pages people read to the end and then leave. Neither tool is broken; they are counting different things.
Is there still a time on page metric in GA4?
Not under that name. GA4 has no "time on page" and no "average time on page" metric — not hidden in an exploration, not behind a setting. If you need the time for a single page, take average engagement time per active user from the "Pages and screens" report; that is the successor, and the click path is in the next section. When a plugin, a dashboard or an agency report still shows you a "time on page" for GA4, it is either renamed engagement time or a number from a different tool.
Where to find each number in GA4
Four click paths, each answering a different question:
- Reports → Engagement → Overview — three scorecards at the top: average engagement time, engaged sessions per active user, and average engagement time per session. The fastest look, but site-wide.
- Reports → Acquisition → Traffic acquisition — engaged sessions, engagement rate and average engagement time per session, broken down by channel. This is where you see whether the traffic a channel delivers is worth anything, and the fastest way to weigh two channels that look alike in a session count and not here: direct traffic, most of which is mislabeled something else, and traffic from AI assistants, which arrives in small numbers and behaves nothing like search.
- Reports → Engagement → Landing page — sessions and average engagement time per session per entry page. The right report when you want the per-session value for a single page.
- Reports → Engagement → Pages and screens — average engagement time per active user, per page. Engaged sessions do not appear here: the report counts views, not sessions.
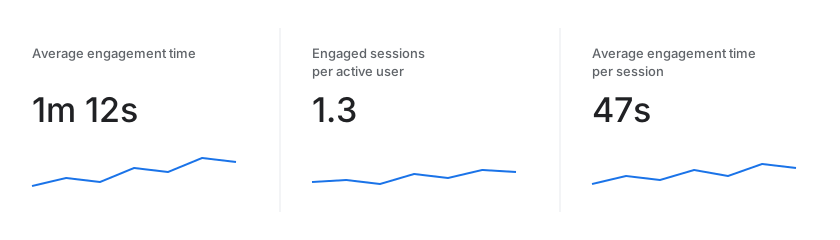 The scorecards on the Engagement overview. The first one says plain average engagement time — it is the per-active-user value, not the per-session one two cards over.
Step by step: engagement time for a single page
- Open Reports → Engagement → Pages and screens.
- Type the page's path into the search field above the table —
/pricing, not the full address. - Read the Average engagement time per active user column next to the row.
- For the per-visit reading of the same page, open Reports → Engagement → Landing page instead and filter the same way. Mind the difference: that report only counts the sessions that started on this page.
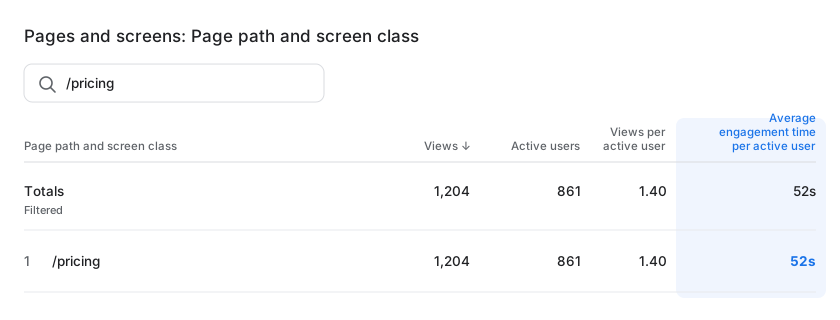 Pages and screens, filtered to a single path. The right-hand column is the per-active-user average; the per-session value for the same page lives in the Landing page report.
Step by step: engaged sessions per landing page
The combination none of the standard reports offers, built in two minutes:
- Open Explore in the left navigation and start a Blank exploration.
- Under Variables, add the dimension "Landing page + query string" and the metrics "Engaged sessions", "Engagement rate" and "Average engagement time per session".
- Drag the dimension into Rows and the metrics into Values, then sort by engaged sessions.
The resulting table is the one you actually wanted all along. The same exploration is where average session duration lives, if you want it beside the others.
Labels move around between GA4 releases; the structure holds. Session-based metrics live in reports that count sessions, user-based metrics in reports that count users. If a column you expect is missing, it is usually the report and not the account.
When engagement time reads zero
A row that says 0m 00s is the most common complaint about this metric, and it is almost never a broken account. Four causes cover nearly all of it, and they are told apart by where the zero sits.
One row at zero, one country, one landing page. That is not a reader, that is traffic behind which no browser ever ran. Bots and ghost hits fire a page view and then nothing, so neither a second event nor a flush ever carries an _et out. Zero engagement time next to a suspicious spike in sessions is one of the clearest signatures there is, and the rest of them are in bot traffic in GA4.
The whole property at zero, but only today. Standard reports lag behind; the Realtime report and DebugView do not. If yesterday has numbers and today does not, wait out the processing window — up to 48 hours — before touching anything.
Zero everywhere, yesterday included. Then no user_engagement event is arriving. Usually the tag is on the page but the page hands over too quickly: a redirect, a consent layer that reloads, a splash screen. Open the Network tab as described above and check whether any request to /g/collect carries an _et after you scroll. If only the first hit ever goes out, GA4 has your page view and nothing else to measure with.
A value that is real but implausibly low. Rejected consent does not zero the metric, it dilutes it. Consent Mode advanced sends cookieless pings that GA4 cannot attribute to anyone, and the modeling that fills the gaps in the conversion reports works on users and key events, not on a page's engagement average. A high rejection rate therefore shows up here as a thinner sample rather than as a visible hole.
And one cause that is not one: the average is not divided by engaged sessions. Half the guides on the web say it is, which quietly pushes the value up and would make a zero impossible to begin with. GA4 divides by all sessions, the four-second visits included — which is exactly why the number can sit near zero on a page with real readers on it.
Engagement time in Looker Studio and the Data API
Dashboards built on the GA4 connector have both averages as ready-made fields, named as they are in the interface. Pull the numbers through the Data API yourself and you get the raw total instead: userEngagementDuration, the summed engagement time in seconds. The two averages are yours to build from it — divided by sessions for the per-session value, by activeUsers for the per-user one. engagedSessions and engagementRate come ready-made.
That division is where a dashboard and GA4 drift apart. When a tile contradicts the report it is meant to mirror, check the denominator before you check the tag: a per-user total over a session count produces a plausible wrong number, and nothing in the chart points at it.
Segment by landing page, or the number says little
A site-wide average across all pages is about as useful as the average temperature of a hospital. Engagement time only becomes interesting once you tie it to a single page and a search intent. Open "Pages and screens," sort by views descending and read engagement time row by row. How to reconstruct an actual behavior from these reports, instead of just staring at numbers, is in reading GA4 and in more depth in analyzing user behavior. The intent half of that is not in GA4: the queries that brought people to the page sit in Search Console, which is worth connecting to GA4 for exactly this pairing.
Only then can the number be read. Eight seconds on a page that hands over a phone number is a success. The same eight seconds on a guide that promised an explanation is a warning. Engagement time, like bounce rate, is not a grade but an observation you can only read together with the job of the page.
The quiet link to bounce rate
Because the same ten seconds decide both, engagement time and bounce rate move together. Raise a page's engagement time and you almost automatically lower its bounce rate — both values measure the same thing from two directions. That also means the two are not two findings. If you are working on one of them, you do not need a second project for the other; the concrete steps are in reducing bounce rate.
Frequently asked questions
What is the average engagement time in GA4?
The time visitors had your site open, visible and in focus — averaged two ways. Session-based reports like "Traffic acquisition" divide it by sessions, while the scorecards and "Pages and screens" divide it by active users, and GA4 shortens both to "average engagement time" depending on where you look. When two reports disagree, they are showing the two different averages, not an error.
What is average engagement time per session in GA4?
The total time your visitors had the site open and in the foreground, divided by the number of sessions in the period. Unlike the old average session duration it counts only active foreground time, and it divides by all sessions, including those that ended after a couple of seconds.
What counts as an engaged session in GA4?
A session that lasts longer than ten seconds, or includes at least one key event, or produces two or more page views. Any one of the three is enough. The ten-second threshold can be raised to as much as 60 seconds in the data stream's tag settings.
Where do I find engaged sessions in GA4?
In the "Traffic acquisition" report under Acquisition, as a column next to engagement rate, and as "engaged sessions per active user" on the Engagement overview. For engaged sessions per landing page you need an exploration with the dimension landing page.
Where do I find duration in GA4?
In the "Engagement" report under "Pages and screens." The column is called average engagement time per active user and replaces the former average session duration. There is no direct equivalent of the old metric anymore.
Is there still a session duration metric in GA4?
Yes, but not in the standard reports. "Average session duration" can be added in an exploration or a customized report. It measures the span from a session's first event to its last, idle time included, which makes it a different number from average engagement time per session.
What is engagement_time_msec in GA4?
The event parameter GA4 uses to ship engagement time. Each event carries the milliseconds that accumulated since the previous one while the page was visible and in focus, and GA4 adds those slices together into the engagement metrics. When a page goes into the background, a user_engagement event flushes whatever is left over.
Why is engagement time lower than the old duration?
Because GA4 only counts the time the tab is active in the foreground, while the old version estimated time between page views and recorded the last page as zero seconds. The two numbers are not comparable; a drop after the switch is a measurement effect.
What is the difference between engagement time and time on page?
Time on page came from Universal Analytics and was the gap between two page-view timestamps, which made the last page of every visit zero seconds. Engagement time counts foreground time directly, so exit pages and single-page visits get a real value instead of a zero.
What is the difference between engagement time per session and per user?
Per session divides the total engagement time by all sessions, per active user by the individual people. Because one person can have several sessions, the per-user value is the larger of the two, often by a factor of two. For "how long does someone spend with this page," take per active user; for "what is one visit worth," take per session.
How do I see engagement time for a single page in GA4?
Open "Pages and screens" under Engagement, filter the table by the page's path and read the average engagement time per active user column. For the per-session value, filter the "Landing page" report the same way — it counts only the sessions that began on that page.
Where do I find time on page in GA4?
Nowhere — GA4 has no metric by that name, and the old Universal Analytics one was retired along with it. The closest equivalent for a single page is average engagement time per active user in the "Pages and screens" report. It measures foreground time instead of the gap between two page view timestamps, which is why it also counts exit pages.
When does a session end in GA4?
After 30 minutes without an event, by default. The next event after that starts a new session. The timeout can be set between five minutes and seven hours 55 minutes in the data stream's tag settings; every "per session" metric shifts with it, engagement time itself does not.
How do I find average session duration in GA4?
Through a blank exploration: import the "Average session duration" metric under Variables, drag it into Values and put a dimension into Rows. Alternatively the same metric can be added to a standard report via Admin → Report display → Customize reports. It does not appear in any report as shipped.
Why does GA4 show an average engagement time of 0m 00s?
Either the sessions never sent an engagement event, or the data is not processed yet. Single rows at zero are usually bot traffic: it fires a page view and then nothing that could carry engagement_time_msec. If the whole property reads zero for the current day, it is normally the processing lag, which can run up to 48 hours. If yesterday is zero as well, check in the network tab whether any request carries an _et at all.
Is average engagement time per session divided by all sessions or only engaged ones?
By all sessions. This is the most repeated error about the metric: sessions that ended after two seconds and never became engaged sessions still sit in the denominator and pull the average down. Dividing by engaged sessions instead gives a flattering figure that matches no report in GA4.
How do I get average engagement time in Looker Studio?
The GA4 connector offers both averages as ready-made fields, so nothing has to be calculated. If you build them yourself through the Data API, take userEngagementDuration as the total and divide it by sessions or activeUsers, depending on which of the two averages you want.
How do I increase average engagement time per session?
Not by making the page longer. The number rises when the visits behind it get better, which mostly means the landing page keeping the promise that brought people there. It is the same work that lowers bounce rate, because both metrics hang on the same ten seconds, and the steps are in reducing bounce rate.
What is a good average engagement time per session?
There is no useful benchmark, because the number depends on what the page is for. A contact page with 20 seconds is doing fine; a guide with 20 seconds is not. Compare a page against its own history and against pages with the same job, never against a figure from an industry study.